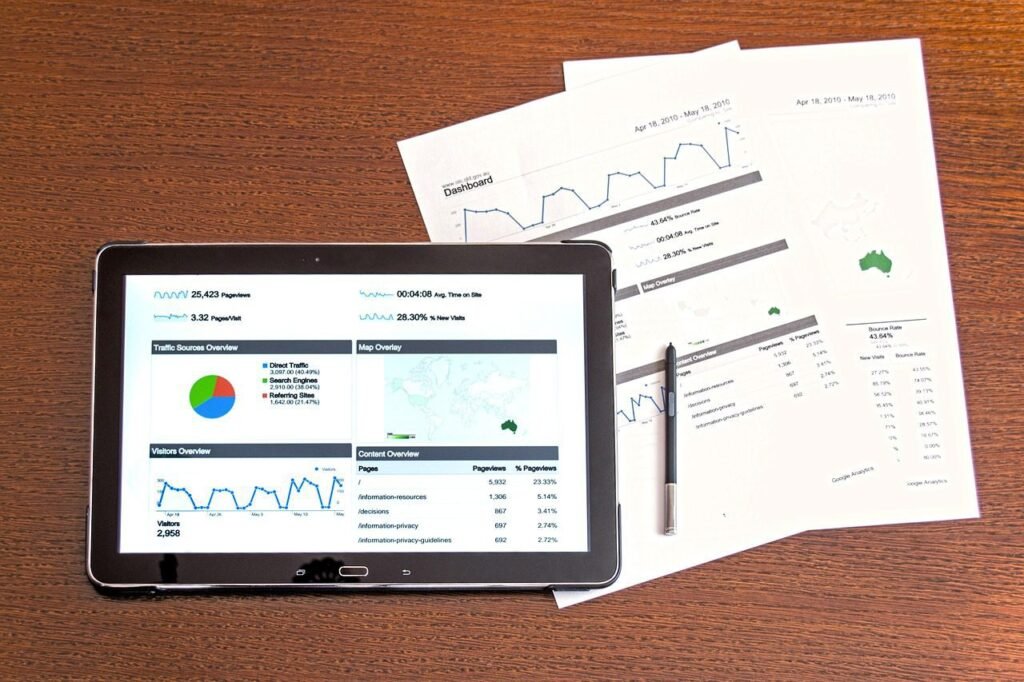
Google Analytics is an SEO analytics tool that is commonly used in the digital marketing industry. It can seem a bit complicated at first when it comes to understanding the differences types of businesses in this world. But just because it can be complicated, doesn’t mean it has to be.
In this post we’re going to dive into nine different Google Analytics reports that can make your life that much easier, and in the process gain a better understanding as to how it is that this tool works in delivering a better user experience on your website. So why don’t we get started with an especially versatile report known as channels?
1) Channels
You can find this particular report by navigating to “Audience”, “All Traffic”, and then “Channels”. Now in a perfect world, your SEO content would land you at the top of the lists for prospective clients and do all the work for you. But this isn’t a perfect world, and it’s not always that easy. Instead, by using this specific report, you can get a better look at what your clients are looking at and looking for, which will certainly give you a leg up on the competition.
2) Source/Medium
Next up is “Source/Medium”. You can get to this report by navigating to “Acquisition”, “All Traffic”, then “Source/Medium”. This tracks overall traffic, as well as where it is that your visitors are coming from. This way you can see whether your Facebook, email, or some other presence is doing the brunt of the work for you, and find out where you should concentrate your efforts.
3) Users Flow
You can find this report by navigating to “Audience” and then “Users Flow”. This site is super helpful if you want to find out where your visitors are spending their time and how they’re navigating through your site. It also tells you the most common sequences that visitors will take between the pages. So if the majority of visitors go directly from your homepage to the listings you have, you know you’re in good shape.
4) New vs. Returning
First off, you can find this report by going to “Audience”, then “Behavior”, then “New vs. Returning”. This one will give you a good look into your analytics to see what your bounce rate is and gauge whether or not there’s a dropoff when it comes to visitors coming to your site.
5) Exit Pages
This report can be found under “Behavior”, “Site Content”, and then “Exit Pages”. This report is great for finding out which page your visitors will leave off on most often, allowing you to tailor your content and make it that much more enticing to get visitors to stay, and ideally, choose your services or products.
6) Top Events
This report is under “Behavior”, “Events”, and then “Top Events”, and it monitors the actual specific actions that visitors will take when they’ve come upon your site. This will allow you to continuously improve your visitors’ experience, and it also allows you to test different parts of your business website in order to figure out what works and doesn’t work for you before making something live.
7) Frequency & Recency
Frequency & Recency can be found under “Audience” and then “Behavior”. There’s a good chance you’re going to experience some drop off on your business site, especially with visitors that you turn into leads. Because think about it: Why would someone keep visiting your site if they already know and appreciate what you do? With that in mind, this report will show you how frequent and recent views on your business site are.
8) Landing Pages
You can find this particular report by navigating over to “Behavior”, “Site Content”, and then “Landing Pages”. When it comes to making sure that your business website is a huge success, you’re definitely going to want to figure out exactly which of your pages are gaining the most traction. This is because sites that have more landing pages on their sites tend to have far better conversion rates overall. This report keeps this in mind and gives you a good idea as to which of your pages are doing the best.
9) Content Drilldown
You can find this report by going to “Behavior”, then “Site Content”, then “Content Drilldown”. This report takes advantage of different subfolders that you might use on your business site and uses these to figure out which among them is giving you the most traffic. This report is going to be ideal for those business owners who have an extensive subfolder system going on, as it will point you to where you’re best off concentrating your efforts.
Final Thoughts
If you’ve got your business license and are looking to find the best Google Analytics reports, these reports will help you tremendously. Google Analytics all traffic report is a clever way to engage your clients and uncover new leads. Among the different marketing strategies, you’re best off in internet marketing by following the tips we’ve laid out and taken advantage of all the reports that Google Analytics has to offer.
Tech content on this site may include contributed articles and partnerships with industry voices. Learn more in our Editorial Policy.


